How can RDMs help us understand the Brain?
Representational Dissimilarity Matrices (RDMs) allow the comparison of response dissimilarities to various stimuli.
But how do you compare different stimuli in the brain?
That is actually not that trivial.
How do you interpret neural data?
Let’s say we measured neural activity with an ECoG.
These are usually implemented in epilepsy patients to measure their seizures.
And this data also helps us understand the brain better.
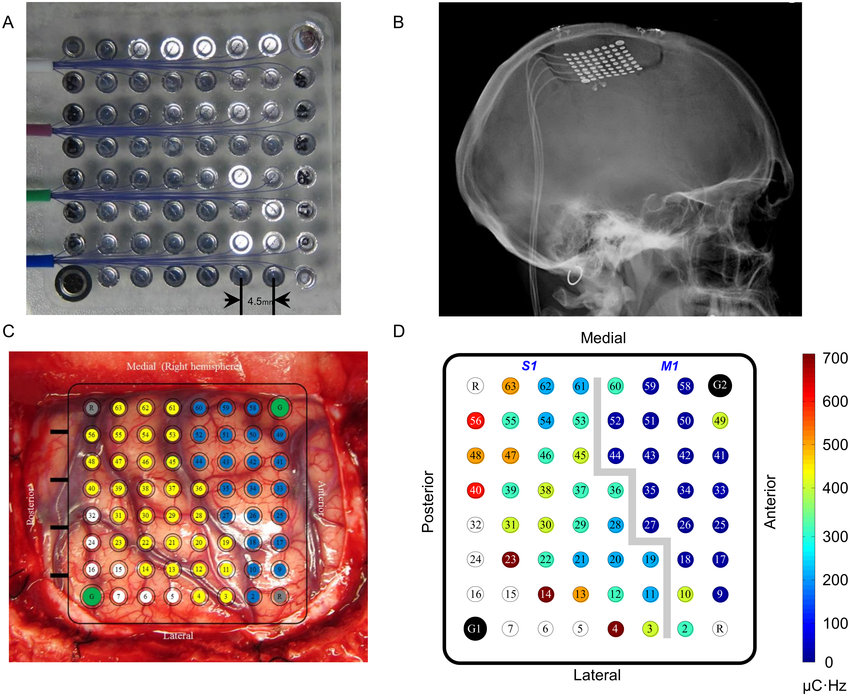
https://www.researchgate.net/publication/316981907/figure/fig1/AS:11431281257208593@1719610200417/ECoG-grid-and-activation-thresholds-A-Photograph-of-the-high-density-ECoG-grid-used-in.tif
So, if we were to measure three neurons which are very close to each other, we can display the activity with a 3D plot. Each axis represents the activity of a neuron:
Let’s start with a 2D space.
If a stimulus A elicits both neurons z and y, stimulus A will be displayed at the coordinates (1, 1). Here are screenshots from the z-y-axis.
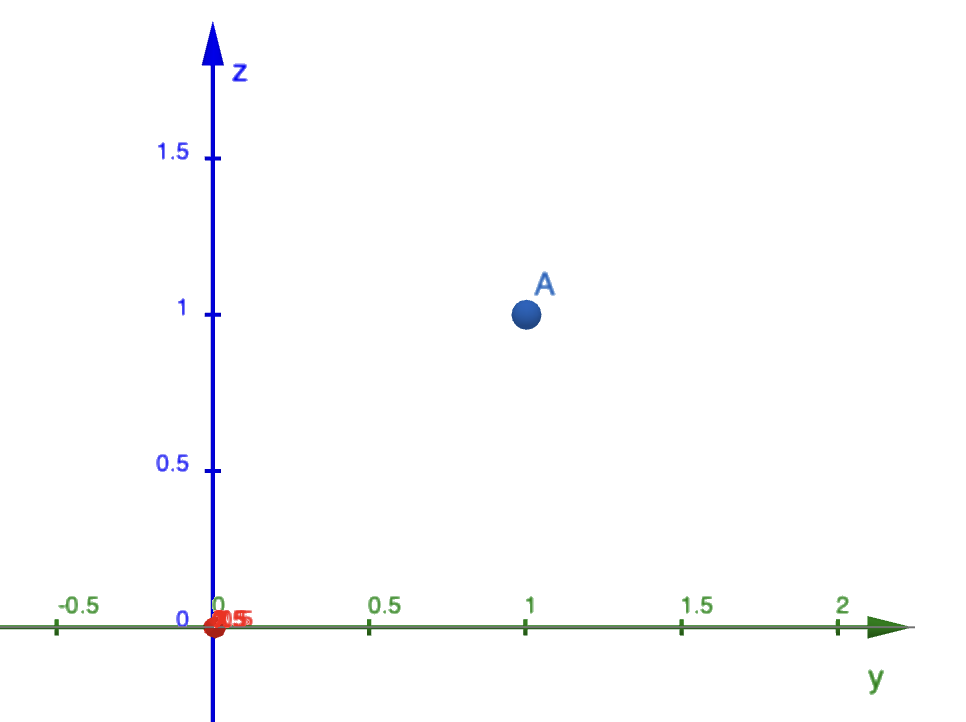
Now we add a third neuron on axis x.
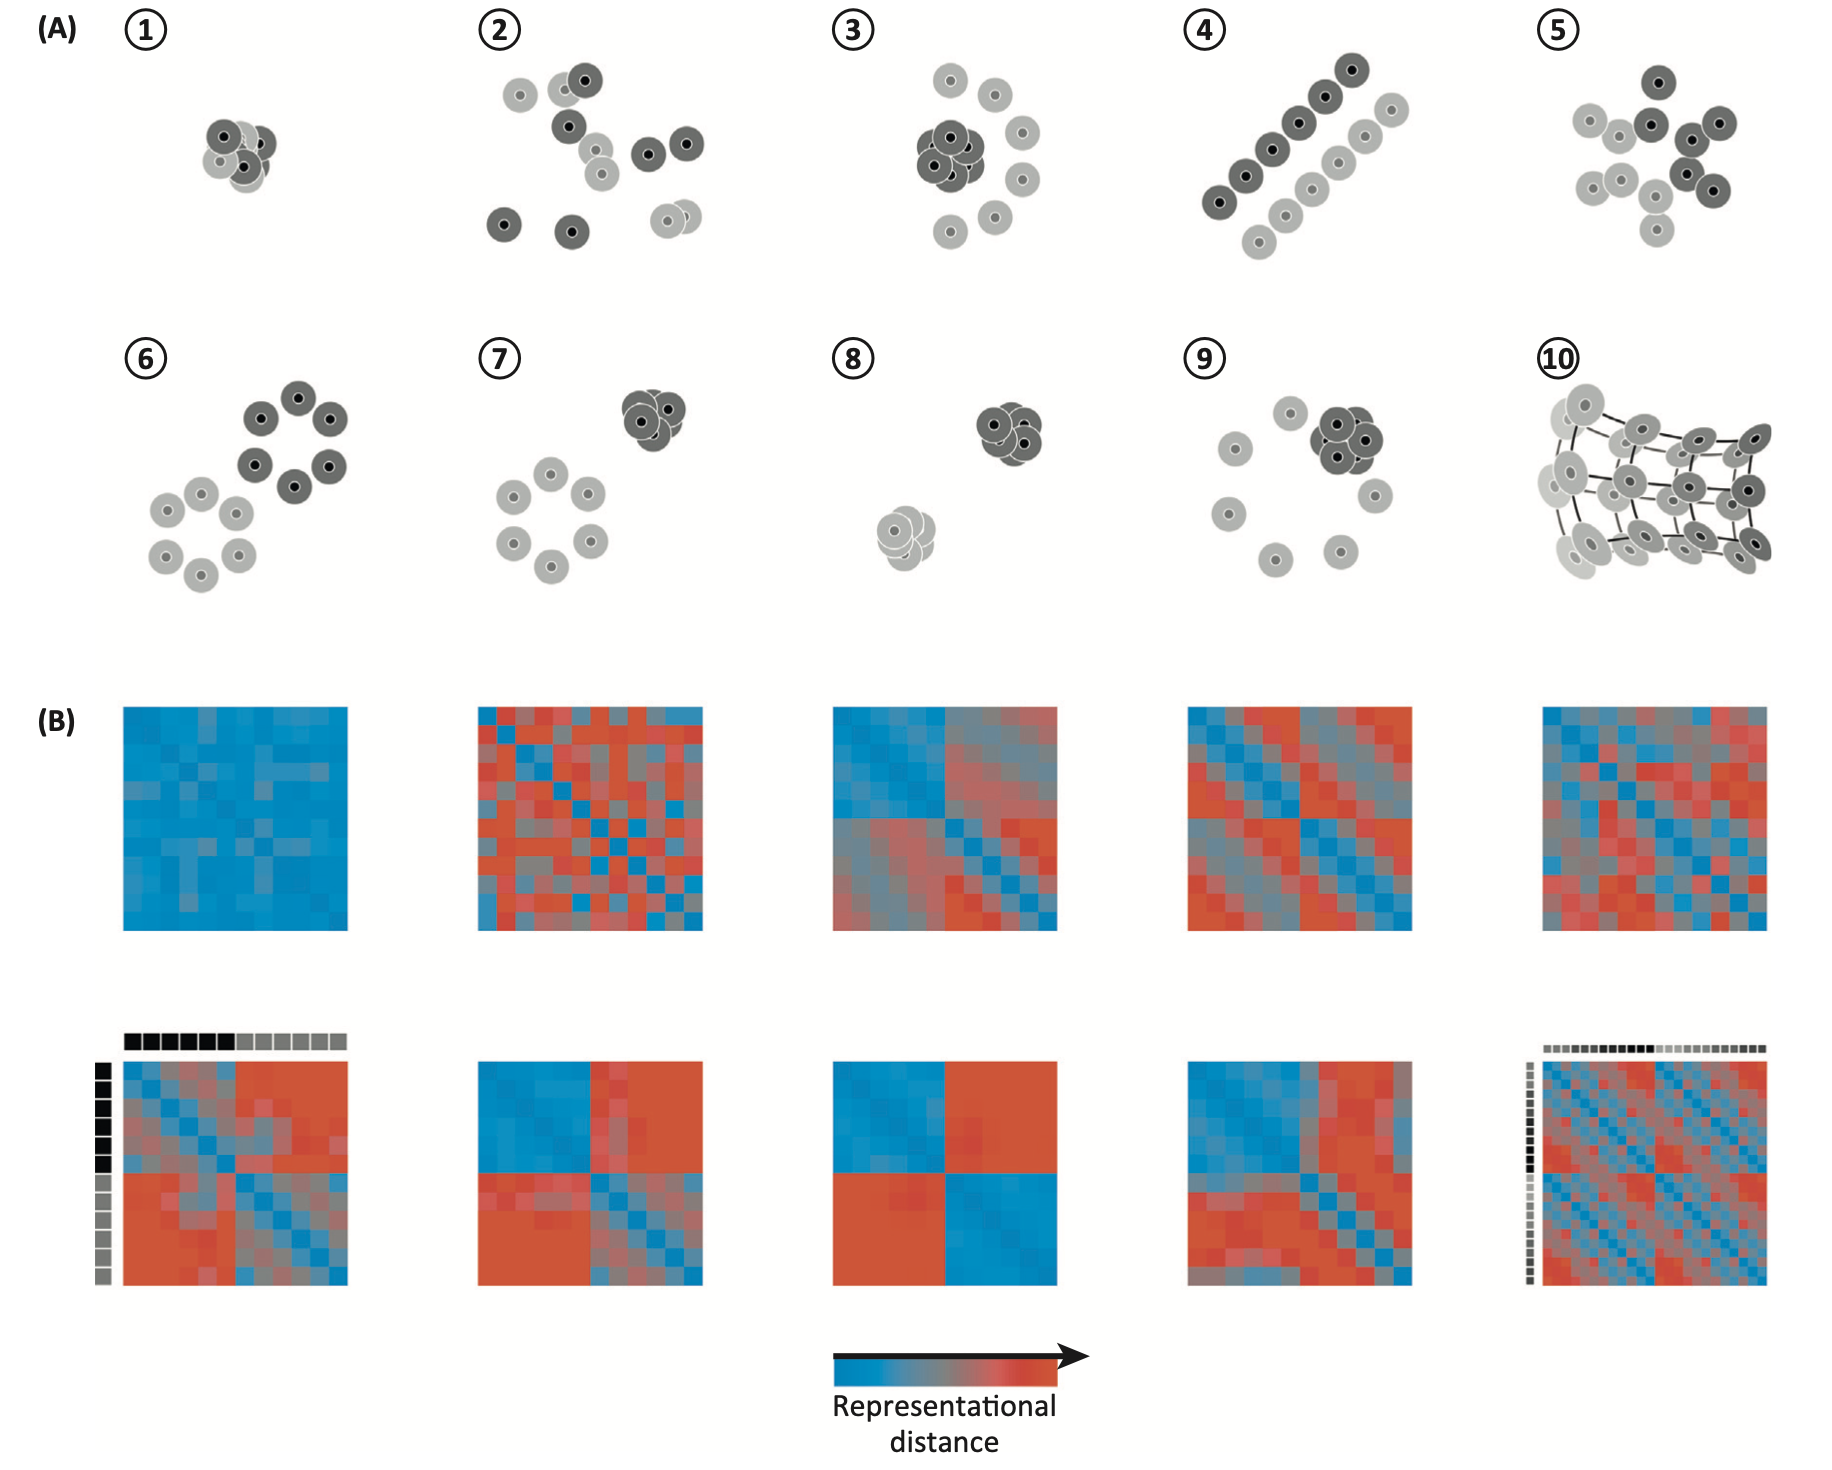
So, the different stimuli recorded might look like this:
red, blue, green and grey are all different stimuli with varying patterns of firing of the neurons.
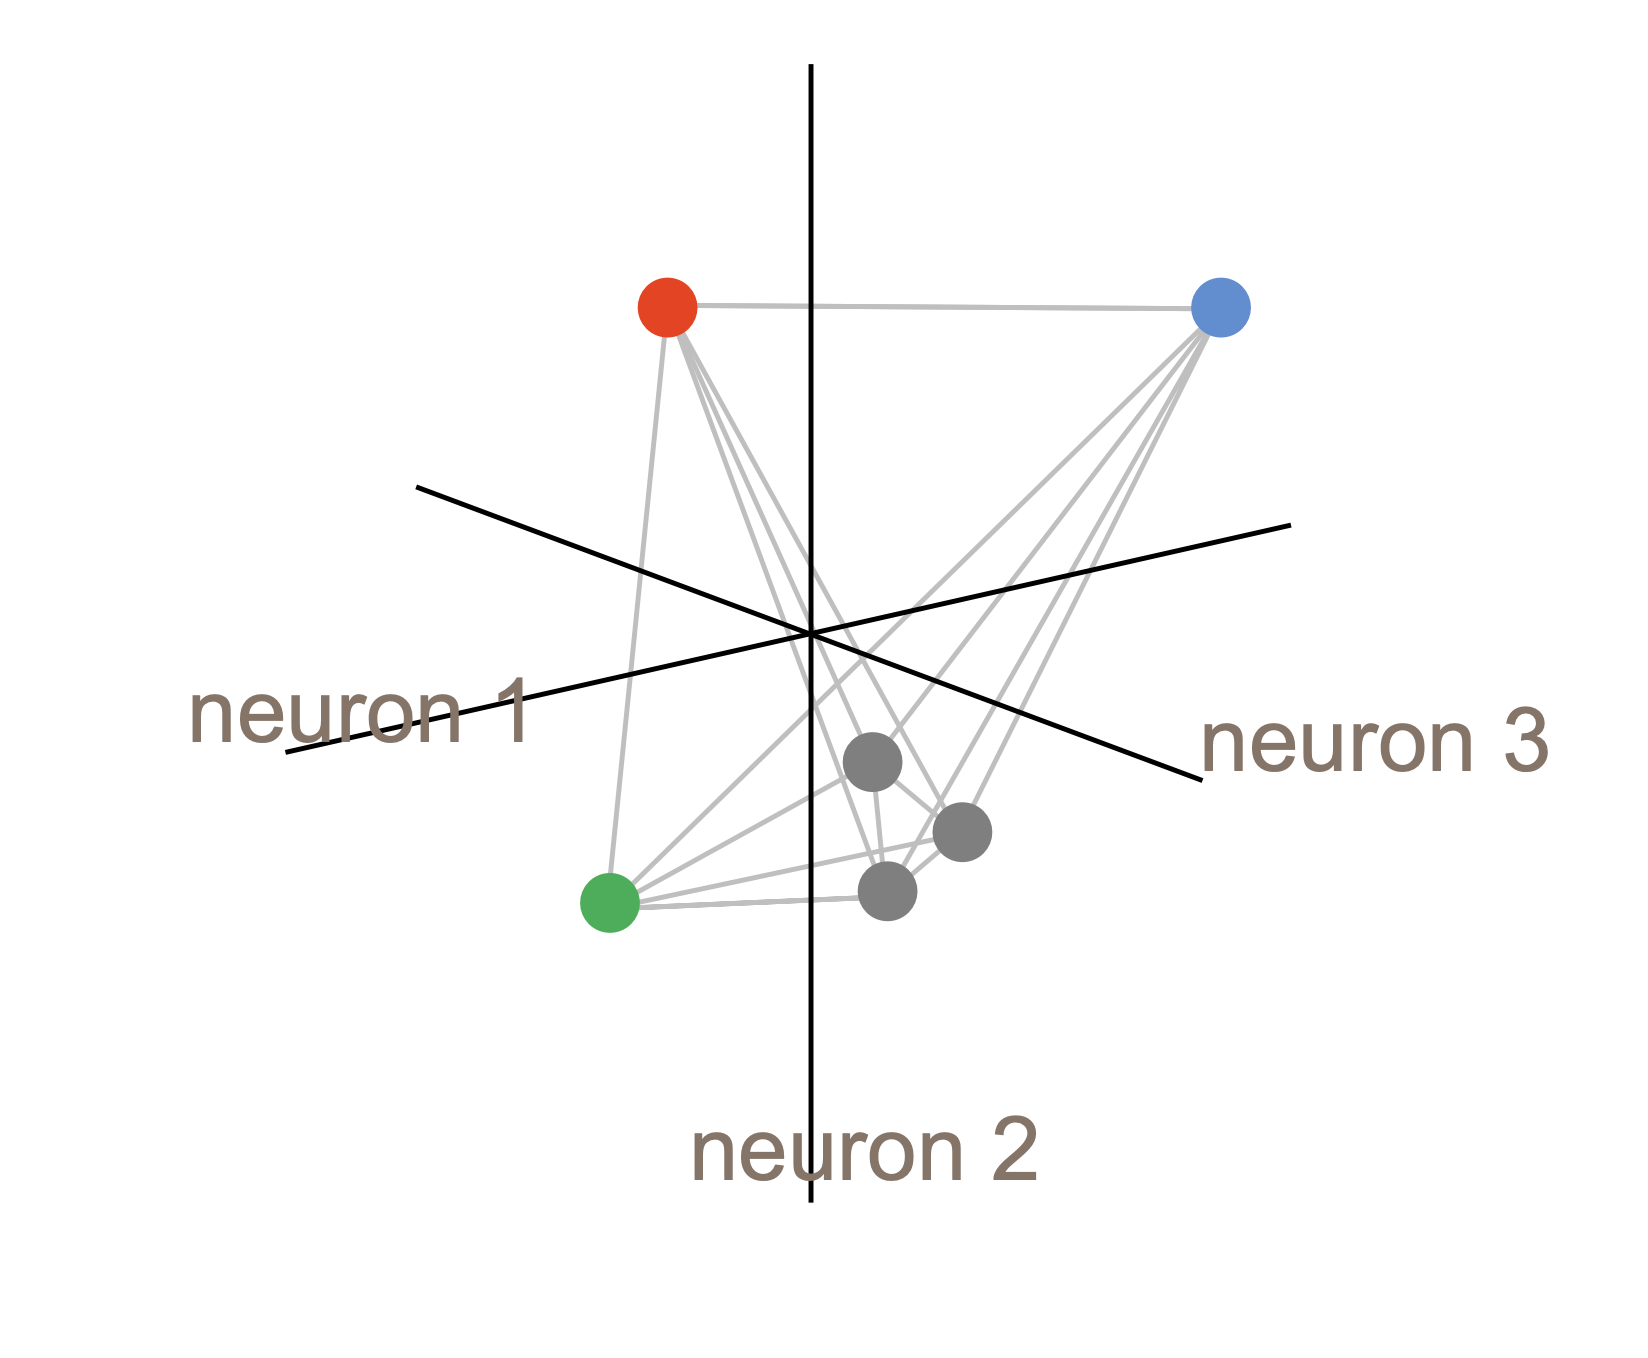
credit: Niko Kriegskorte
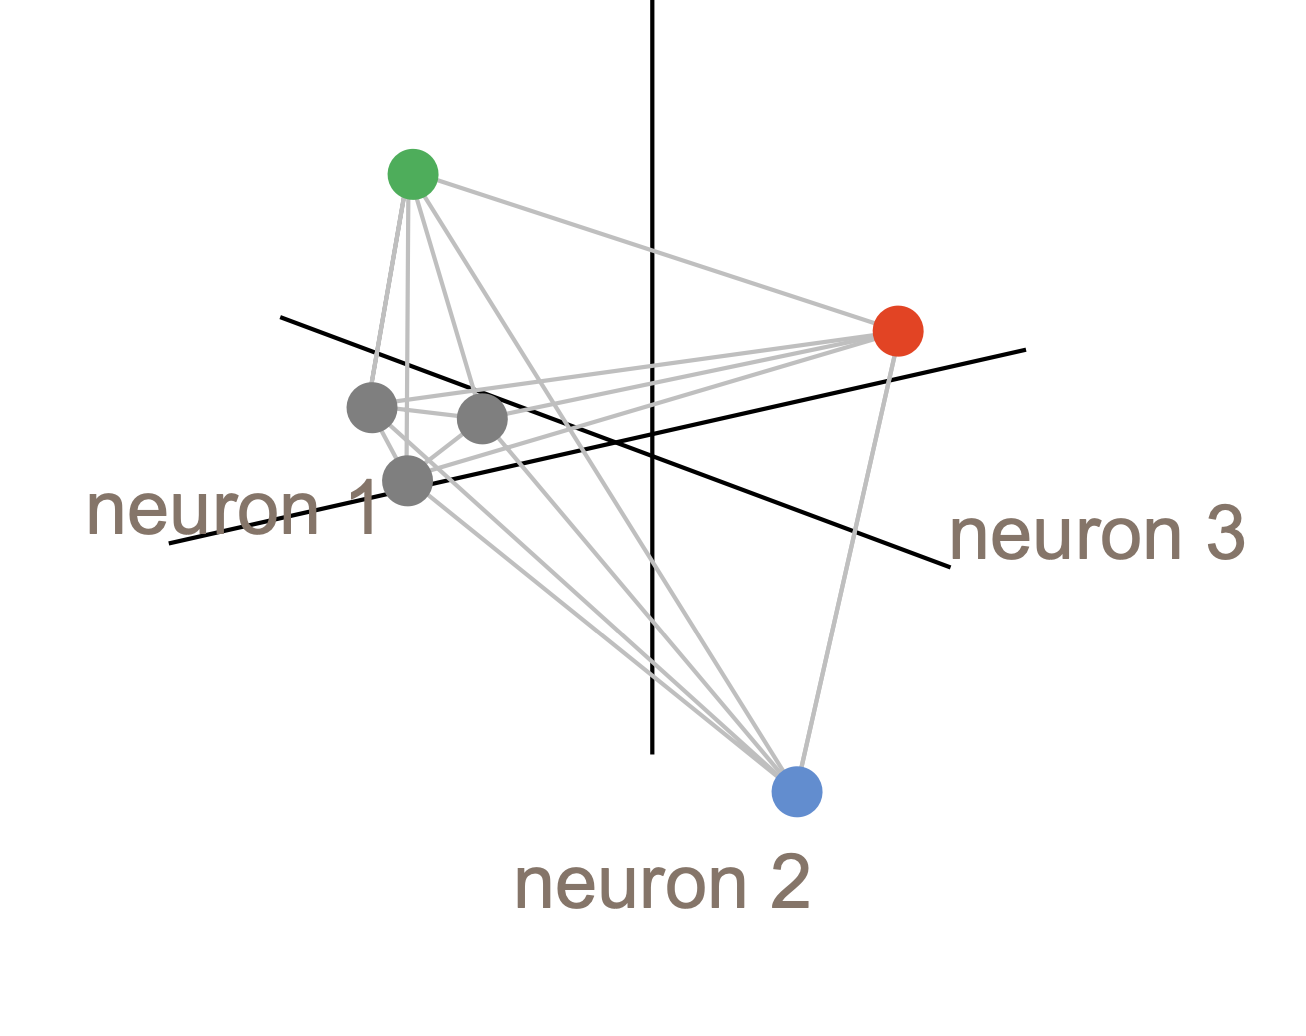
credit: Niko kriegskorte
What happens if we record more than three neurons?
We cannot display 4D space. With every neuron, we add a dimension to represent the different firing patterns.
This will leave every stimulus with a long vector of firing for each neuron.
How do you display these vectors?
You cannot. But we can mathematically measure the distances of these vectors.
You can do that in several ways. Calculating the angle of the vectors (cosine distance), or adding the distances like counting meters in a grid-like city(Manhattan distance).
There are many more distances you could use.
It depends on what you want to express and what the neural data looks like
There are different techniques to compare these vectors
I will show you:
That makes RDMs highly interpretable and comparable with other RDMs, making them especially useful for exploring information representation in specialized brain regions like the FFA (fusiform face area).
RSA (Representational Similarity Analysis) takes the analysis a step further by transforming RDMs into long vectors for better comparison between them.
These tools allow researchers to explore questions like whether the FFA specializes beyond face-selectivity.
In Op de Beeck’s study, The RDMs show clear distinctions between the stimuli of various birds in the frontal cortex and IT of bird experts, which were not observable in controls.
FFA not only responds to faces but also to areas of expertise. A study by Gauthier shows higher activity in the FFA for categories of expertise such as cars or birds.
Experts even show higher activity in FFA when not paying attention. Also, right FFA shows more activity for expertise categories than the left FFA.
This supports the findings of Op de Beeck study shown in the RDMs.
This leads to the conclusion that the Fusiform face area might be better called the flexible fusiform area (Gauthier, 2000).
see also
Type:
Tags:
Status:
Location:
Created: 19-11-24 12:21
Mein Blog
Machine Learning for Cognitive Computational Neuroscience